 Mall Metrics
Trading analytics
Trading rhythm by hour and daypart
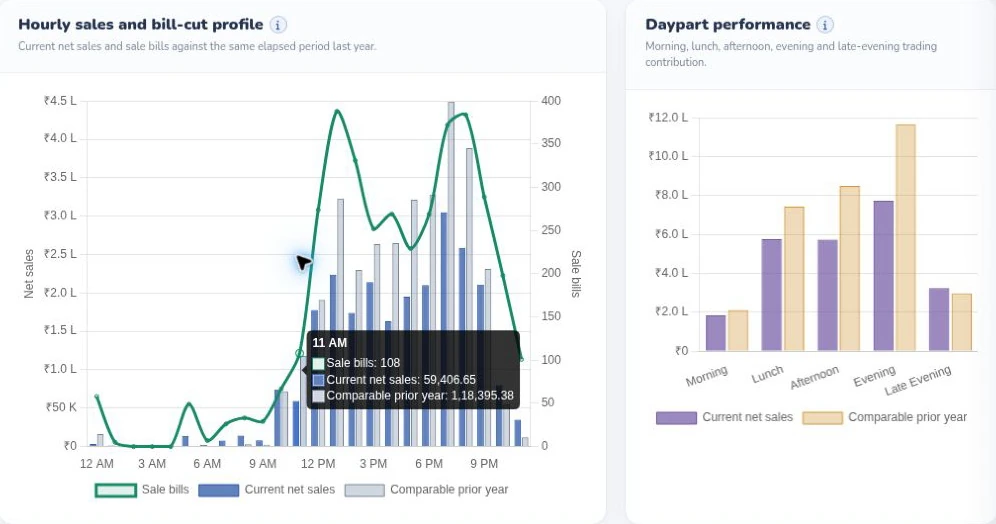
Compare the hourly sales curve and bill count with the prior year, then see how morning, lunch, afternoon, evening and late-evening trading contribute to sales.

Follow sales from a tenant’s daily close to reconciliation, portfolio comparisons and the boardroom. Explore what each team sees along the way.
Compare the hourly sales curve and bill count with the prior year, then see how morning, lunch, afternoon, evening and late-evening trading contribute to sales.
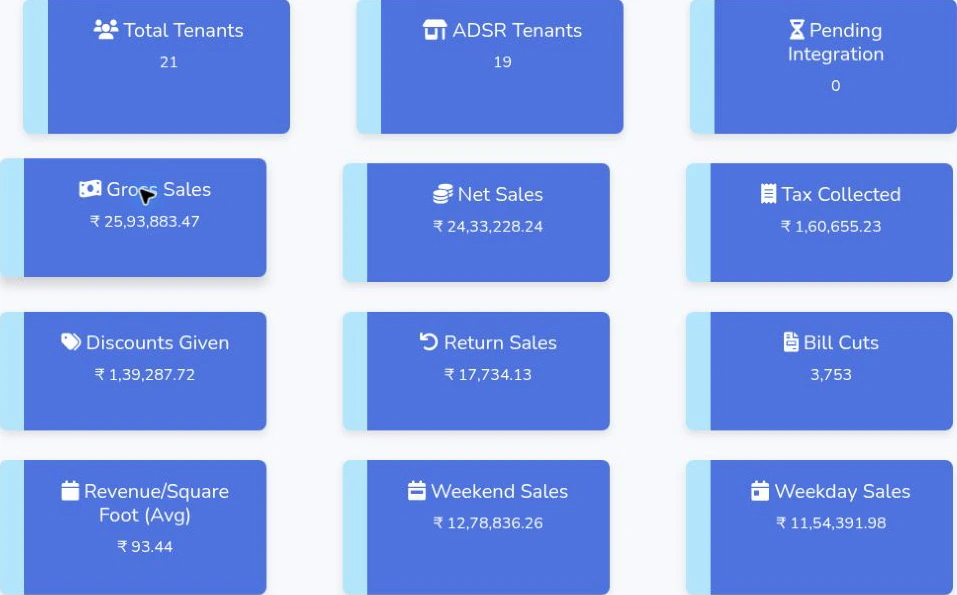
Read twelve operating measures together, including tenant coverage, gross and net sales, tax, returns, bills and the weekday–weekend split.
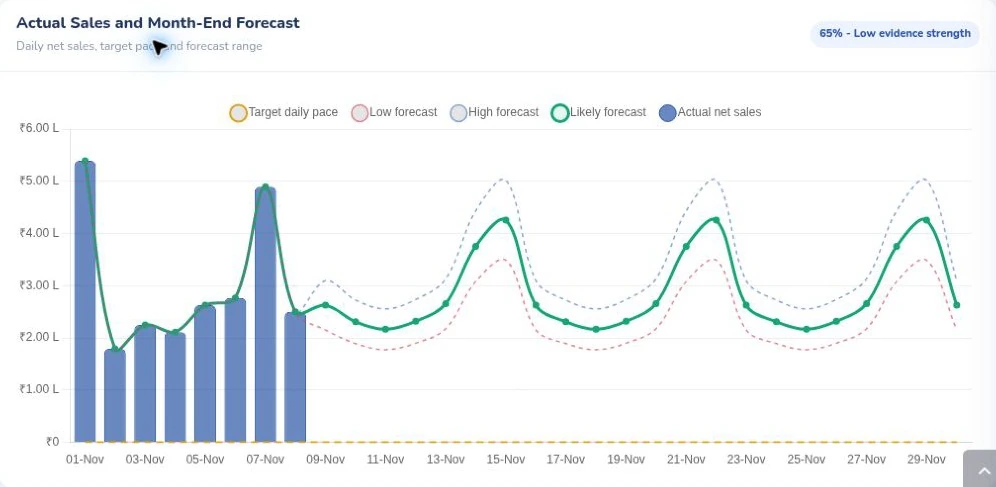
The bars show reported daily net sales through 8 November. The lines extend the likely, low and high daily forecasts to month-end. The evidence rating travels with the projection.
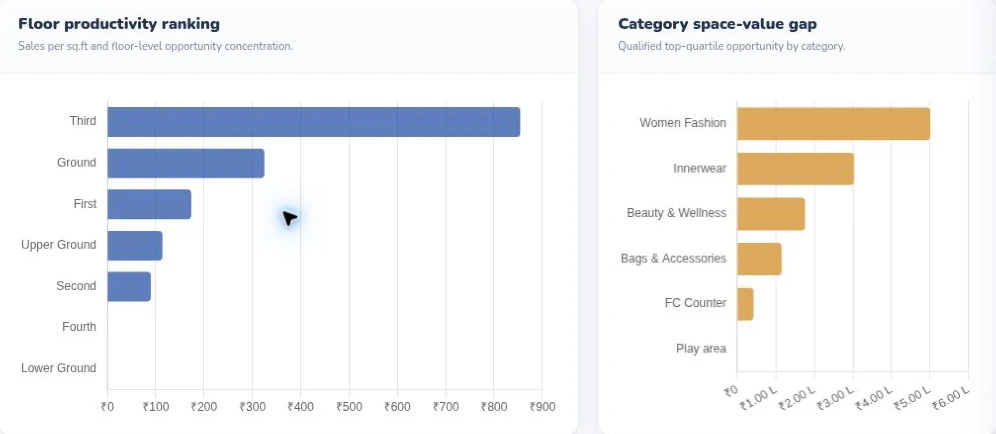
Read rupees per square foot by floor next to each category’s estimated gap to its top-quartile benchmark. The two charts use different units.
Identify the trading date, tenant, shop, category and floor. The workspace includes daily and monthly entry screens, a zero-sale record, and POS and file-format configuration. Agree the supported input for each tenant during onboarding. A feed test should include a sale, a return and a corrected close.
A shopping center may use percentage rent, while another property refers to turnover rent or gross turnover (GTO). Agree the report currency, area unit, trading-day cutoff and lease definition property by property. The screens in this tour use an Indian demonstration environment.
Open Sales Summary to separate gross sales, returns and net sales. Inspect Missing Sales Days when a figure is absent. Monthly Sales Comparison puts the POS, manually reported and CA-certified numbers in adjacent columns. Differences can then be discussed against the underlying period and scale.
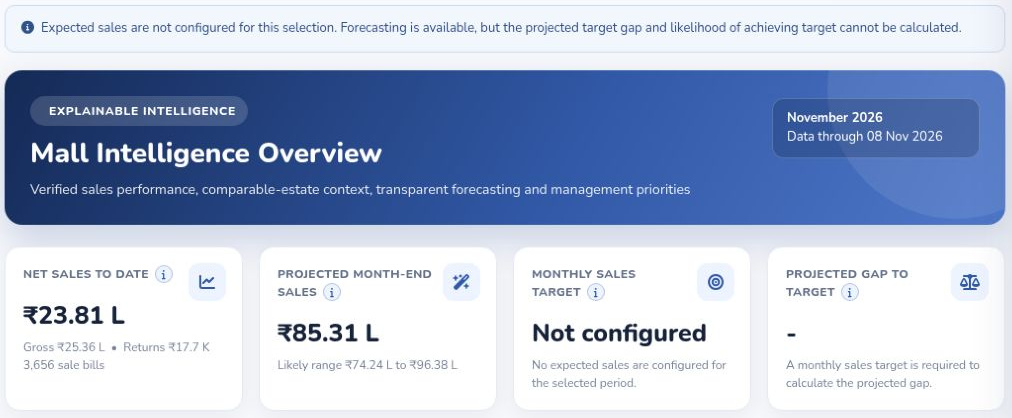
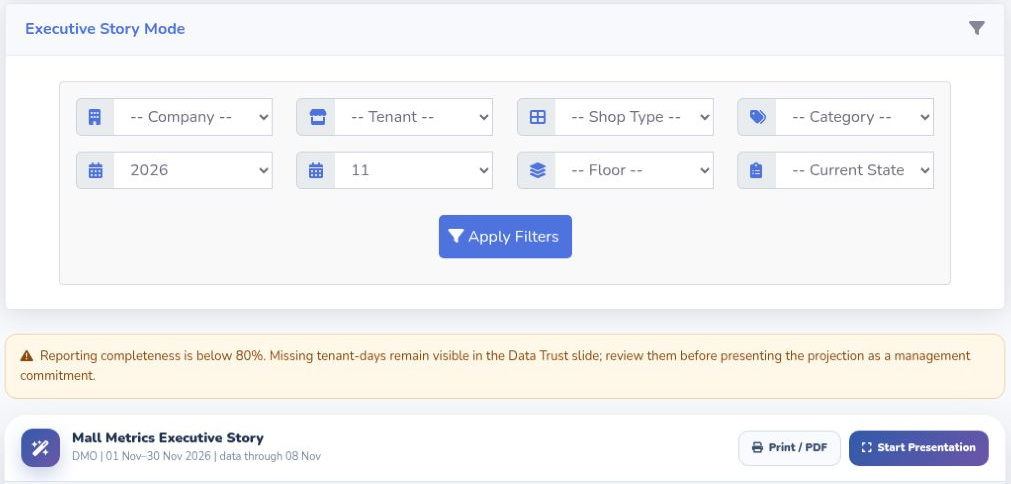
Choose the month and authorised properties. Compare Malls shows the evidence date and which properties contributed. At a single mall, the Mall Intelligence Overview separates reported from like-for-like performance and shows estate movements. The CEO Cockpit adds a board scorecard and management priorities.
Finance can open agreement billing terms, sales-basis policies, billing readiness and rent calculations. The Lease Billing Reports workspace shows a Projected Rent Summary with actual and forecast sales, completeness and period state. Bring one anonymised agreement to see which policy and records apply to your mall.
Browse the report library · See actual product screens
See how tenant submissions become a finance review and a management brief.