Report library

A report for every trading decision.

Find the view that answers your next management question, from outstanding tenant reports to a projected rent review.

Inside the platform

Reports in this workflow

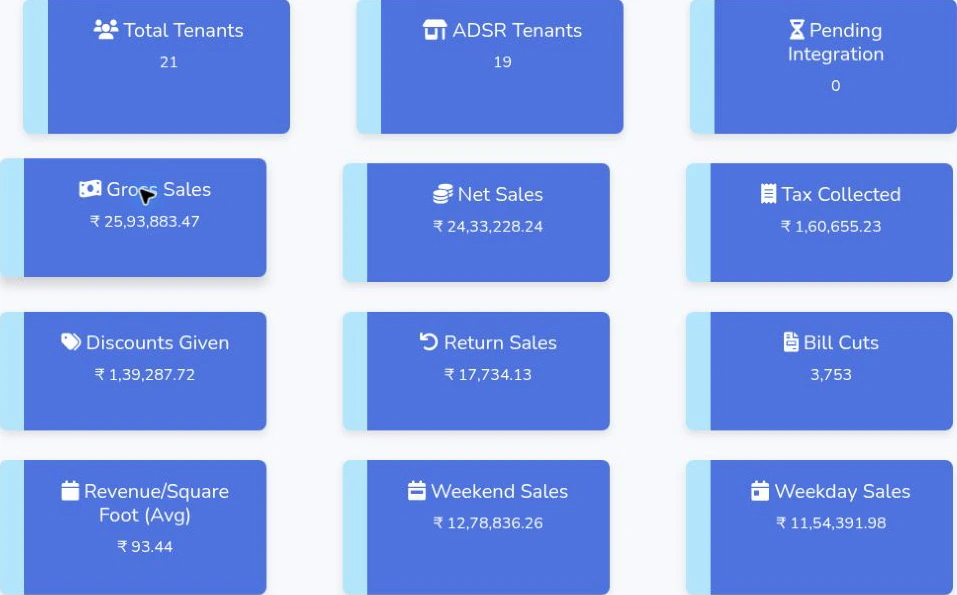
Twelve blue KPI tiles show property-level counts and rupee measures in the Monthly Summary report.
Management dashboards

Monthly sales and operations scorecard

Read twelve operating measures together, including tenant coverage, gross and net sales, tax, returns, bills and the weekday–weekend split.

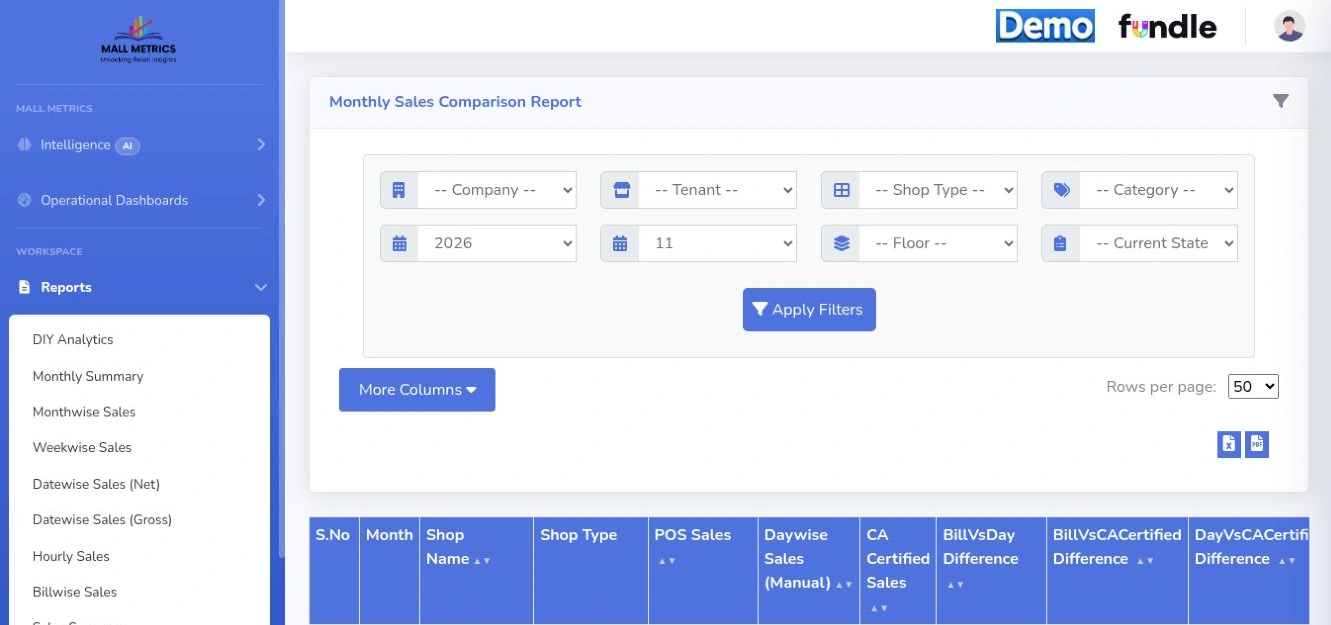
Original demo layout showing the report navigation, period filters, export controls and column headers. Tenant records are outside this crop.
Financial reporting

Sales reporting workspace

The report menu provides hourly, daily, weekly, gross, net and billwise views. The open November 2026 monthly comparison report exposes POS, manual and certified sales columns and source-pair differences.

Report directory

Find a report by workflow.

See product screens
Daily trading and reporting coverage7 views

Start with a trading date, then drill down to a store, hour or bill.

Datewise Sales (Net)
Compare tenant net sales for each trading date.
Datewise Sales (Gross)
Read the gross sales figure for the same daily period.
Hourly Sales
Locate the hour blocks when stores recorded sales.
Billwise Sales
Inspect bill-level records within the permitted property scope.
Daily Sales Analysis
Review daily movement across shops and shop types.
Missing Sales Days
Find the stores and trading dates that still need a submission.
Zero Sales Days
Check dates explicitly recorded as zero trading.
Monthly performance and productivity8 views

Move between the category summary, store totals and productivity per unit of space.

Monthly Summary
Read the month by tenant class, category and trading date.
Monthwise Sales
Compare monthly totals across shops and shop types.
Weekwise Sales
Compare weekly totals within the selected month.
Monthly Sales Analysis
Inspect the shop-level monthly comparison grid.
Week Days Analysis
Compare weekday and weekend trading for the selected period.
Yearly Comparison
Review the year-on-year monthly breakdown.
Tenant Monthly Sales
See gross and net sales, returns, bills, sales per square foot and zero billing days together.
Revenue Efficiency
Compare the average, highest and lowest revenue per square foot.
Reconciliation and commercial reporting8 views

Give finance the source, period and sales basis behind a figure.

Sales Recon Analysis
Compare POS, daily declarations and certified monthly sales with a difference for each source pair.
Sales Summary
Separate gross sales, net sales and returns by shop.
Recorded Sales
Inspect recorded sales, returns, bill counts and zero billing days for the period.
Monthly Revenue
Review the monthly revenue grid by shop and shop type.
Yearly Expenses
Select the expense period and the available report output.
DIY Analytics
Configure a custom report and choose the relevant measures.
Projected Rent Summary
Read actual and forecast sales, rent, completeness and the evidence date.
Billing Readiness
Review the tenant-month register before commercial close.
Intelligence and executive analysis18 views

Examine what changed, assess the reliability of an estimate and decide where to investigate.

Why Sales Changed
Inspect the sales change bridge, category drivers and data-quality effects.
Forecast Accuracy
Compare forecast checkpoints with historical closes and examine error or bias.
Scenario Planner
Test how assumptions about bill count, basket value and returns affect a projected close.
Footfall & Demand
Compare sales and transactions with visitor traffic where coverage permits.
Trading Rhythm
Inspect hourly trading, dayparts and day-of-week patterns.
Seasonality & Events
Compare trading around an event with a matched baseline.
Risk & Opportunity
Review the priority tenant list, then inspect the evidence behind a signal.
Tenant Intelligence 360
Open the tenant intelligence workspace in the selected property context.
Peer Benchmarking
Compare productivity with the peer median and upper quartile.
Revenue Leakage
Investigate unusual returns or discounts using peer and commercial-quality measures.
Portfolio Concentration
Examine how much sales contribution depends on individual tenants and categories.
Space Productivity
Compare share of sales with occupied area and rank productivity by floor.
Shopper Journey
Review identified cross-tenant visits and category affinity where those data are available.
Shopper Retention
Compare cohorts and repeat visits over a defined period.
Action Centre
Review prioritised signals, their status and recent action activity.
Intelligence Digest
Access the scheduled intelligence digest workspace.
Ask Mall Metrics
Open the property-scoped business question interface.
Business Glossary
Review metric definitions used in the operating reports.
Property operations dashboards9 views

Explore the operating measures alongside sales when the property supplies the underlying data.

ADSR
Read annual and monthly tenant sales comparisons.
Sale Variance
Compare current-month category achievement and cumulative actual versus expected sales.
Parking
Review peak-hour entries, weekday and weekend counts and average duration.
Footfall
Inspect monthly visitor totals and year-to-date movement.
Customer Survey
Review survey response counts and rating trends over time.
Tenant Survey
Inspect tenant ratings, NPS and monthly response counts.
Utility
Review usage patterns and consumption per visitor.
Complaint
Review open-ticket ageing and resolution time by department.
Manpower
Compare staffing, vacancies and headcount utilisation.
Six report walkthroughs

Choose your report.

Which stores still owe a number?

Missing Sales Days lists the shop, missing date and missing-days count. Zero Sales Days is a separate view for investigating reported zero trading. Check the trading calendar and store status before treating an absence as a decline. Read the missing-versus-zero guide

What did each tenant report?

Sales Summary shows gross sales, returns and net sales. Datewise Sales offers separate gross and net reports. Weekwise and Monthwise Sales give a tenant-by-period matrix. Hourly Sales helps identify when trade took place. Tenant Monthly Sales brings bill counts, returns, sales per square foot and zero billing days together.

Where do the figures disagree?

The interface calls this Sales Recon Analysis. Its report heading is Monthly Sales Comparison Report. Compare the POS total with the daily declarations and the CA-certified statement. The difference columns let finance isolate a source pair before asking for supporting evidence. Explore reconciliation

Which stores or centres need a meeting?

Use Revenue Efficiency for a per-area view. Use Peer Benchmarking and Space Productivity to put a store in context. The group comparison adds net sales, comparable prior dates, sale bills, average transaction value, footfall and revenue per visitor where inputs are available. See how portfolio comparison works

Which number is ready for finance?

Projected Rent Summary has columns for completeness, evidence date, actual and forecast sales, actual and projected rent, and period state. Review these with the agreement and the readiness register before treating a number as billable. Explore the lease workflow

View the report screenshots · Request a report walkthrough

Product walkthrough

Bring one mall.
Follow one trading day.

See how tenant submissions become a finance review and a management brief.

Book a demo
Product screen

Open full resolution ↗
Book a demo

Mall Metrics advisor

ADSR product support and demo enquiries

What would you like to know about Mall Metrics?
Book a demo

Fundle stores this conversation so the team can follow up.