 Mall Metrics
Portfolio & tenants
Current versus prior-year portfolio sales
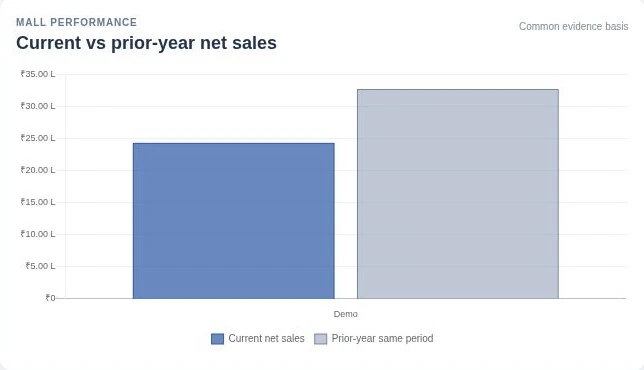
Read current and prior-year net sales for the one demo property with evidence in both periods. The comparison stops at the common evidence date.
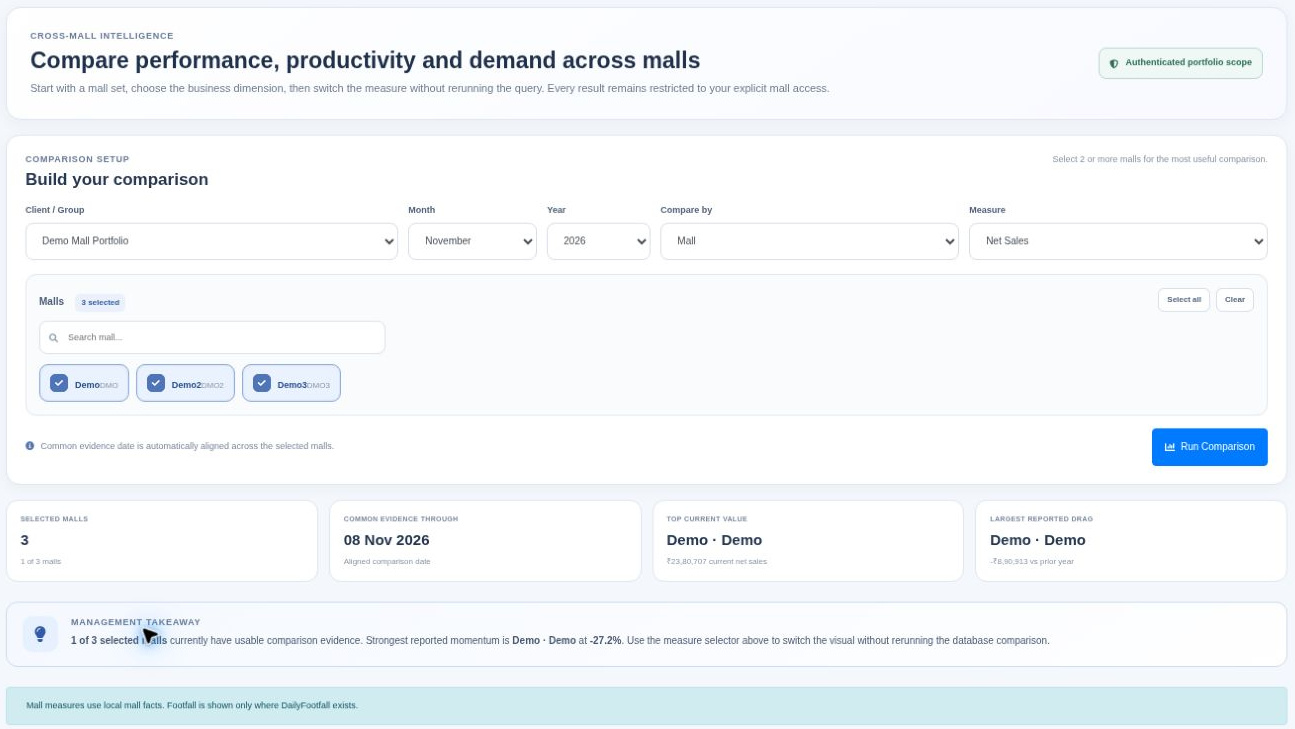
Use Compare Malls before the group performance review to ask which property, category or floor contributed to a change. The comparison builder leads into charts for current versus prior-year net sales and growth ranking, followed by a detailed ranked grid. The grid identifies the mall, dimension member and evidence supporting each comparison.
Read current and prior-year net sales for the one demo property with evidence in both periods. The comparison stops at the common evidence date.
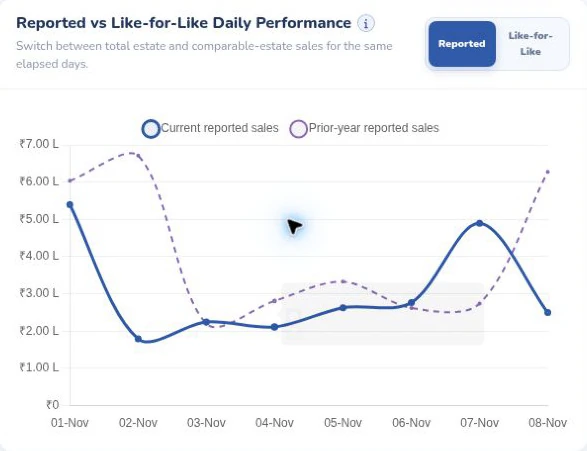
The chart is shown in Reported mode. Compare current and prior-year net sales, then switch to like-for-like in the product to examine the comparable estate.
Alongside sales and year-on-year growth, the grid has columns for sale bills, average transaction value, sales per square foot, footfall, bills per 100 visitors and revenue per visitor. An operator reviewing similar centres might see that one mall has fewer sale bills per 100 visits but a higher average bill value. That gives the centre head two distinct questions about the tenant mix and how often visits lead to recorded purchases.
Select authorised properties and confirm the common evidence period before comparing the results. If the properties operate in different currencies, establish a consistent reporting currency and exchange-rate policy first. Footfall-based measures require usable visitor counts, while sales density depends on the area basis. Use reported growth at this level, then open the mall’s comparability evidence when the decision depends on the performance of continuing stores.
Read the guide to like-for-like mall sales · Compare properties in a demo
See how tenant submissions become a finance review and a management brief.