 Mall Metrics
Portfolio & tenants
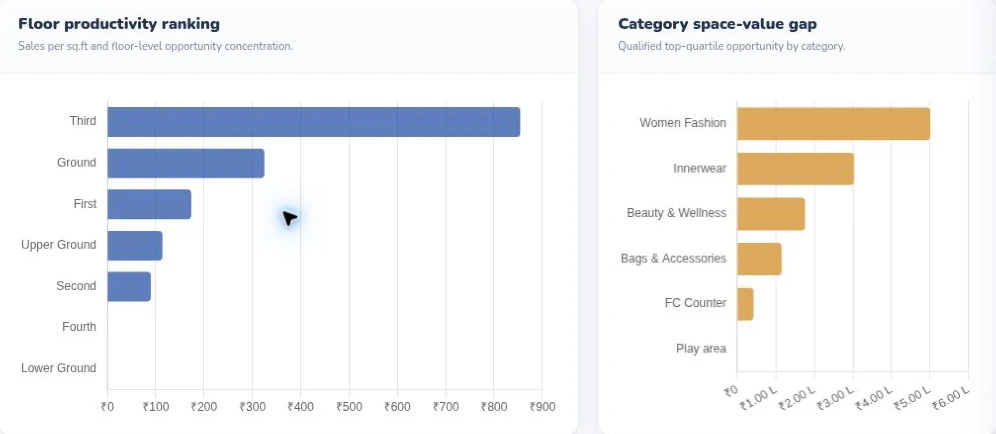
Floor productivity and category space value
Read rupees per square foot by floor next to each category’s estimated gap to its top-quartile benchmark. The two charts use different units.
A 60 m² jewellery shop can generate less total turnover than a 300 m² apparel store and still generate more sales for each unit of floor area it occupies. Trading density gives leasing and asset teams a way to examine that difference. Divide the agreed tenant sales for a stated period by the relevant trading area. Quote the result with both units and period, such as A$2,500 per m² for June.
Read rupees per square foot by floor next to each category’s estimated gap to its top-quartile benchmark. The two charts use different units.
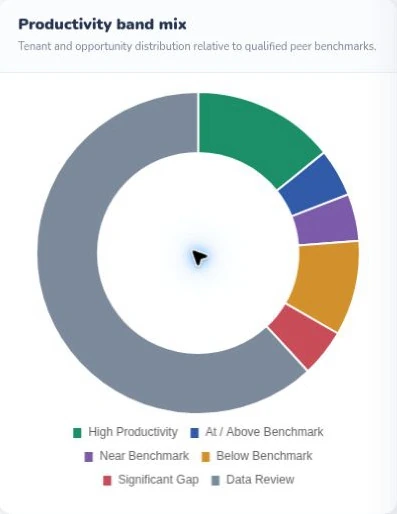
Compare tenant counts across productivity bands, including the data-review group. Use peer-qualified records when assessing a store’s productivity.
Start with the tenancy record. Many malls maintain more than one area field, including carpet area and chargeable area. Choose the field that fits the decision, document it and apply it to every shop in the comparison. A shop with 1,000 sq ft of carpet area and 1,200 sq ft of chargeable area has two valid answers to two different questions. For a cross-border comparison, 1 m² is about 10.764 sq ft. A$2,500 per m² is therefore about A$232 per sq ft before any currency translation.
Ask whether the unit expanded, contracted or temporarily relocated during the period. If the area changed halfway through a month, retain the effective date. For a monthly equivalent, one possible policy uses an area weighted by the number of applicable days. Another compares the periods before and after the change separately. Expose the policy alongside the result, especially when it affects a renewal discussion.
Take two illustrative Australian shopping centre tenants on the same area and sales basis. An accessories store sells A$150,000 in 60 m², giving A$2,500 per m² for the month. An apparel store sells A$360,000 in 300 m², giving A$1,200. Together they generate A$510,000 from 360 m², or about A$1,417 per m². Simply averaging the two shop densities gives A$1,850, which overstates the sales generated by the combined space.
For a category or floor, show the combined density alongside the tenant count and reporting coverage. A floor with one high-value jewellery store may have an unusually high density. Showing that shop’s share of the floor total makes the figure more useful during portfolio review.
Compare stores with similar formats, merchandise and trading calendars. Check the number of trading days, stable area, location within the mall and any missing sales. A tenant that opened in the last week of the month may merit a per-trading-day view before a monthly comparison.
The Mall Metrics Revenue Efficiency view shows revenue per square foot by shop, and Tenant Monthly Sales includes a revenue-per-square-foot field. Confirm the field definition and selected period before comparing either figure with a separate tenant calculation. Bring the tenant’s area history and sales basis to a demo to see how the comparison would work for your space.
Explore tenant performance · Read how to calculate like-for-like growth
See how tenant submissions become a finance review and a management brief.