 Mall Metrics
Trading analytics
Trading rhythm by hour and daypart
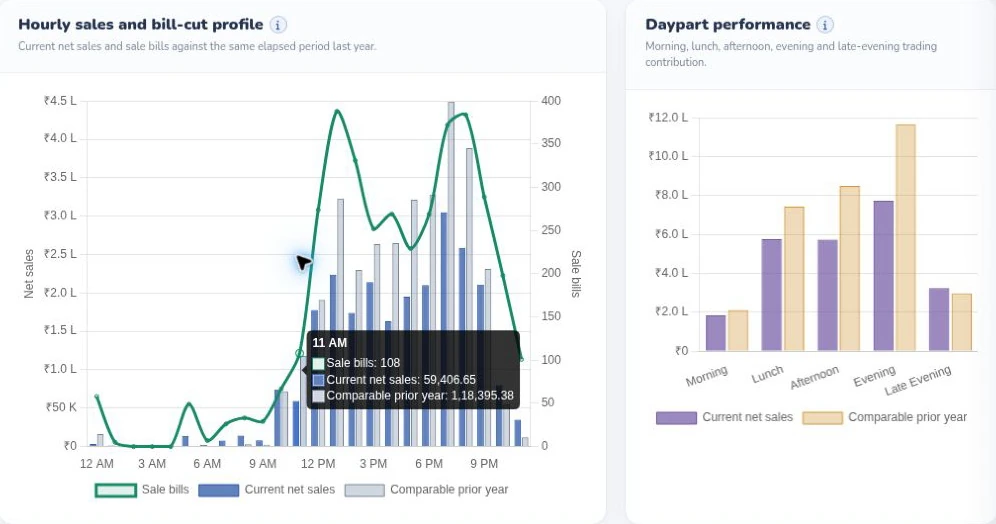
Compare the hourly sales curve and bill count with the prior year, then see how morning, lunch, afternoon, evening and late-evening trading contribute to sales.
A centre manager wants to move a food promotion from Wednesday to Saturday. Last month, weekdays generated more total sales. Does that mean Wednesday is the stronger trading day? A month usually contains more weekdays. The decision needs a per-day measure, a comparable set of stores and a calendar that identifies public holidays, school breaks and festival events separately.
Compare the hourly sales curve and bill count with the prior year, then see how morning, lunch, afternoon, evening and late-evening trading contribute to sales.
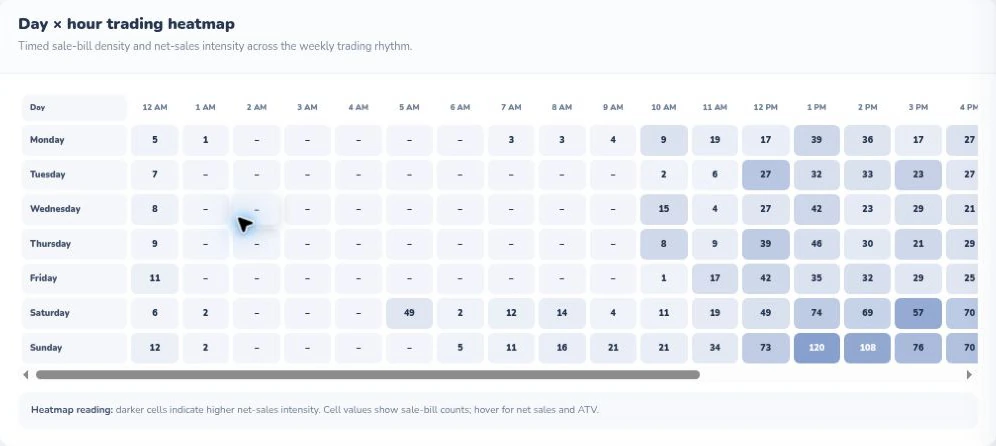
Read down for the weekday and across for the hour. Darker cells identify busier trading windows. This capture shows the visible portion of the horizontally scrolling report.
Agree which days count as weekends for this analysis. Then identify complete trading days for each store and calculate average daily sales within each group. If a key restaurant has missing data on two Saturdays, the simplest mall-wide comparison may use only complete, common days. For a tenant-level analysis, disclose the different day counts and coverage alongside each average.
In an illustrative month at a UAE shopping mall, a group of restaurants takes AED 440,000 across 22 weekdays and AED 240,000 across eight weekend days. Its weekday average is AED 20,000, while its weekend average is AED 30,000. Weekends account for about 35.3% of monthly turnover but generate 50% more sales per day. Both figures are useful. Staffing decisions around peak demand depend more directly on the daily pattern.
The turnover total can hide two distinct demand windows. Saturday lunch might be busy across the food court, while the strongest fashion trading occurs between 5 pm and 8 pm. Ask for an hourly profile by category on the chosen dates. Check how the source treats after-midnight activity and whether all selected tenants provide hourly detail.
Add bill count and average bill value where both are available. If Saturday sales rise due to larger family orders while the number of bills barely changes, kitchen prep may matter more than an additional billing counter. If volumes surge while average bill size stays stable, the bottleneck may be queue capacity. Verify each explanation with the tenant before changing a roster or scheduling an offer.
Use each centre’s local events calendar. A late-night Ramadan programme in a Gulf mall, a bank-holiday Monday in the UK or a Lunar New Year promotion in Singapore can move demand into different hours or day groups. Record the actual event dates before comparing peaks. Consider preparing an “ordinary weekend” view alongside an event-day view. Match similar times of year and equivalent open hours before treating last month’s lift as a forecast.
Mall Metrics includes a Week Days Analysis report and an Hourly Sales view. For a walkthrough, choose one F&B tenant, one fashion tenant and a known event weekend. Ask to see the qualifying day counts and to trace one spike back to a tenant and hour.
Explore tenant performance · See what belongs on the morning dashboard
See how tenant submissions become a finance review and a management brief.